View our SITC 2023 poster

Assessing cytotoxic T cell responses in live tumor fragments (LTFs™) with multiphoton microscopy

 
SITC poster

Have you seen CD8 TILs in action?

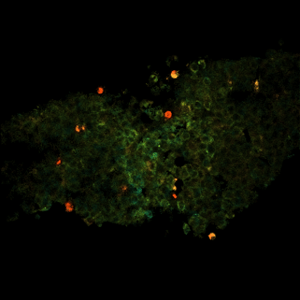
Mobile CD8 TILs in a human Live Tumor Fragment (hLTF)™

What you are looking at is:

  • Live CD8 T cell mobility assay over an hLTF
  • Structural context included with multispectral exogenous and endogenous (collagen) imaging
  • Two photon timelapse obtained volumetrically
  • Metabolic imaging unveils the effect of TIL-induced cancer cell killing longitudinally over human multiple cancer subtypes

tils picture

Label Free screening of hLTF viability and T cell content 

What you are looking at is:

  • Label-free spectral imaging provides a baseline assessment of tissue fragment viability and overall T cell content in a high throughput fashion.
  • Intensity image timelapse provide live CD8 T cell mobility assay over entire hLTF.
  • Structural context included with multispectral exogenous and endogenous (collagen) imaging
  • Two photon timelapse obtained volumetrically
  • Metabolic imaging unveils the effect of TIL-induced cancer cell killing longitudinally over human multiple cancer subtypes
 

PDX Live Tumor Fragment (xLTF)™ T cell mobility with intact tumor microenvironment

What you are looking at is:

  • Live CD8 T cell mobility assay over an xLTF
  • Structural context included with multispectral exogenous and endogenous (collagen, NADH, FAD, etc.) imaging
  • Two photon timelapse obtained volumetrically
  • Metabolic imaging unveils the effect of TIL-induced cancer cell killing longitudinally over multiple human origin PDX cancer subtypes
  • Elephas generates xLTFs across tumor types of main interest to Biopharmaceutical clients
fragments over time

Label-free metabolic imaging of drug response & efficacy longitudinally

What you are looking at is:

  • Full drug efficacy panels conducted on syngeneic live tumor fragment (mLTF)™
    • Elephas offers hLTF and xLTF on multiple cancer types
  • CT26 colorectal cancer
  • Mechanism of cell death determined on a single-cell basis
  • Flow, cytokine, IHC and other orthogonal assays available as end-point of imaging assay

Cytotoxic TILs attacking CT26 tumor cells 

What you are looking at is:

  • A: CT26 monolayers alone
  • B: CT26 monolayers co-cultured with TILs
  • The gray coloring indicates NADH
  • The green coloring indicates caspase 3/7
  • The magenta coloring indicates propidium iodide
 

Metabolic imaging of cytotoxic TILs attacking CT26 tumor cells 

What you are looking at is:

  • On the left are FLIM images of cytotoxic TILs attacking CT26 monolayers
  • On the right are intensity images of the same field of view
    • The cyan coloring indicates NADH intensity of CT26 monolayers
    • The magenta coloring indicates TILs